D-View 8
D-View 8 Network Management Software
Description
D-View 8 is a comprehensive wired and wireless network management tool based on the server and probe architecture, supporting the troubleshooting, configuration, performance and security of your network. It provides end-to-end business management of IT, scalability of system architecture, and accommodation of new technology and infrastructure while supporting the management of D-Link and third-party devices.
D-View 8’s standard and enterprise license options handle any network requirements, from SMBs to enterprise deployments. The standard licence can manage up to 500 nodes for a single organization on multiple sites. Enterprise license handles up to 5000 nodes and supports multiple server probes, local or remote, across multiple sites and networks.
Real-Time Network Analytics
Real-time network analysis provides insight into network operations, where network visibility is extremely important. With D-View 8 you can gain insight on device statistics, critical alarms of managed devices, running status of wired and wireless devices, CPU/memory utilization, wired and wireless throughput of devices.
sFlow Analyser (Enterprise version only)
D-View 8 uses sFlow analyzer to detect network anomalies in your organization, especially when the network is large and complex. It helps collect the sFlow data from devices and generate related statistics reports.
Role-Based Administration
Provides administrators with both the tools and the ability to grant access and privileges to only those features and resources operators need.
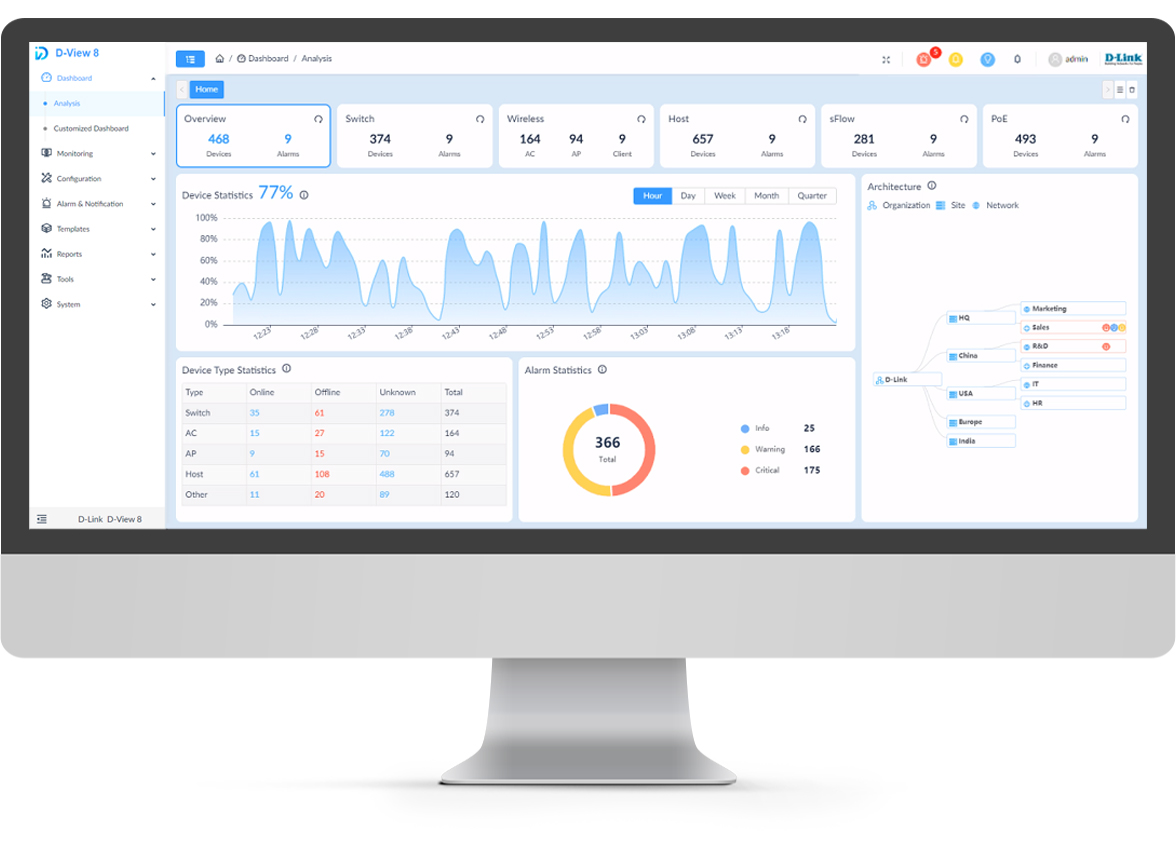
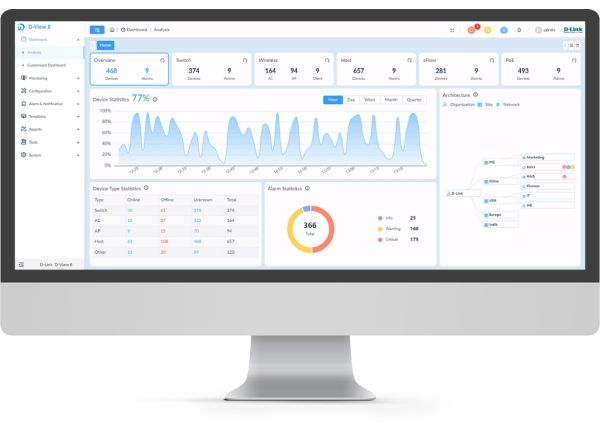
Intuitive Dashboard
The user-friendly dashboard can be customized to your needs for network device overview, device statistics, alarm statistics, cpu/memory utilization, response time, temperature and many more.
Centralized Reporting
Provides performance of administrator, operator performance, and options for resource reporting Configuration and configuration changes, network device and connection status, for network properties, Alarms, and the health of
network equipment. Report types are issued in real time and personalized easily. Device data is given for status, mark, IP address, MAC address, type of device, model, supplier, the location and many more.
Highly Flexible and Scalable Deployment
Depending on your network size, D-View 8 has you covered with a whole suite of network capabilities and deployment options.
Rich Resource Management
Provides the exploration and topology of the network, including comprehensive network inventory and precise representations of how it is configured. Sponsored views include both Layer 2 and Layer 3, as well as Like VLAN topology and the ability, like a dashboard homepage, to create custom views.
Inventory Management
Provides holistic management using a single pane of glass for multi-vendor devices. Administrators can access tools to control and monitor several facets of a network topology, IP, or custom view, the system connects devices to the
network and displays devices. Administrators may also assess a system’s health through the specifics of the device page, which reveals real-time data, summary information, connectivity testing, and more.
Batch Configuration
Configure multiple devices at the same time using SNMP or telnet.
Firmware Management
Conveniently upgrade firmware for multiple devices from a centralized location.
Service Monitoring
Monitors the availability and responsiveness of common network services via probes that you configure. The probes reside on local and remote D-View 8 software agents and test services from servers and devices that you select when configuring the probes.
General features
Nodes Supported
• < 500 (Standard license (DV-800S))
• < 5000 (Enterprise license (DV-800E))
Server and Probe
• Single server (Standard license (DV-800S))
• Single probe (Standard license (DV-800S))
• 2 servers and HA (High Availability) (Enterprise license (DV-800E))
• Multiple probes (up to 20) (Enterprise license (DV-800E))
Probe Type
• Local (Standard license (DV-800S))
• Local & Remote (Enterprise license (DV-800E))
Org-Site-Network Architecture
• Single organization
• Multiple sites
• Multiple networks
Features Supported
• Basic functions
• sFlow Analyzer (Enterprise license (DV-800E) only)
• MIB Browser/Compiler (Enterprise license (DV-800E) only)
• REST API (Enterprise license (DV-800E) only)
• HA (Cluster Mode, Load Balancing) (Enterprise license (DV-800E) only)
Odering Information (Lifetime)
• DV-800S-LIC (Standard license (DV-800S))
• Free maintenance during 1st year
• No maintenance support after 1st year
• DV-800E-LIC (Enterprise license (DV-800E))
• Free maintenance during 1st year
• No maintenance support after 1st year
Annual Maintenance License
• Maintenance and product support based on annual renewal
• Default nodes supported: 30 nodes (w/o annual license)
D-View Server System Requirements
CPU
• Quad-core, 3.5 GHz or above
RAM
• 16 GB or above
Disk
• 200 GB or above
Supported OS (English versions only)
• Windows Server 2012 64-bit (Standard Edition or above with the latest patches)
• Windows Server 2012 R2 64-bit (Standard Edition or above with the latest patches)
• Windows Server 2016 64-bit (Standard Edition or above with the latest patches)
• Windows Server 2019 64-bit (Standard Edition or above with the latest patches)
• Windows 10 64-bit (Professional Edition or above with the latest patches)
• Ubuntu 18.04 or above/ 64-bit
• Debian 10 64-bit or above
Database
• MongoDB 4.0 or above
Web Browser
• Microsoft Edge
• Firefox
• Chrome
• Safari
Remote Probe System Requirements
CPU
• Dual-core, 3.0 GHz or above
RAM
• 4 GB or above
Disk
• 200 GB or above
Supported OS (English versions only)
• Windows Server 2012 64-bit (Standard Edition or above with the latest patches)
• Windows Server 2012 R2 64-bit (Standard Edition or above with the latest patches)
• Windows Server 2016 64-bit (Standard Edition or above with the latest patches)
• Windows Server 2019 64-bit (Standard Edition or above with the latest patches)
• Windows 10 32/ 64-bit (Professional Edition or above with the latest patches)
• Ubuntu 18.04 or above/ 64-bit
• Debian 10 64-bit or above
Managed Capability
• 500 Nodes
Client System Requirements
CPU
• Dual-core, 3.0 GHz or above
RAM
• 4 GB or above
Disk
• 100 GB or above
Web Browser
• Chrome
• Firefox
• Safari
• Edge
System Configuration
Basic Settings
• Organization:
• Configures the organization’s name, country, time zone, etc
• Upload the organization logo in PNG or JPG file format (less than 2MB file size)
• Mail Server:
• Configures mail server information and associated parameters
• Forward Trap:
• Configures the trap receiver to receive incoming device trap messages
• Forward Syslog:
• Configures the system log receiver to receive incoming device syslog messages to the D-View server
• REST API Key Generation (Enterprise version only):
• To generate the API key which will be used by other application to acquire a token from D-View 8
• Third party applications can use tokens to acquire needed information from D-View 8 without sending username and password
• SNMP Protocol Preference:
• Configures the SNMP protocol types, community name and related parameters
• sFlow Settings (Enterprise version only):
• Configures sFlow collector’s associated information
• System Preferences:
• Configures the table display parameter and theme of D-View 8
User Management
• Users:
• Listing user information which contains user’s email address, user name, login time, authentication type etc.
• Add, delete, remove users.
• Role Privileges:
• Listing the types of user role which includes Organization/ Site/ Network Administrator roles.
• Listing each role’s associated function privilege.
• AD Server:
• Configures the Windows Active Directory Server’s information.
• RADIUS Server:
• Configures the RADIUS Server’s information.
• Supports Primary and Secondary RADIUS Server configuration
Scheduling
• Configures the “Recurrent Schedule” and “Time Range Schedule”
• Recurrent Schedule:
• Allows user to configure recurrent schedules with customized frequency and duration
• Time Range Schedule:
• Allows user to configure a specific range of time, such as work hours or holidays
Server Management
• To monitor the status of D-View Core Server, Web Server and Probe
• To check the real-time report of each server’s status, which includes the utilization of CPU memory, hard drive and the network traffic
D-View 8 Logs
• D-View 8 features three types of logs: User Operation Log, System Log, Device Maintenance Log
• User Operation Log:
• Keeps the records of user’s sign in and sign out status
• System Log:
• Keeps the records of D-View 8’s running status for server and probes
• Device Maintenance Log:
• Keeps users’ configuration action log for devices
About Page
• The About page keeps the following information:
• D-View 8’s edition, such as Standard or Enterprise
• Brief description for the purchased edition
• Software version
• The latest update date
• The number of supported and used nodes
• System uptime information
Dashboard
Analysis
• By default, there are six tabs in the analysis page, user can click each tag to display dedicate information. The
Analysis page includes following tabs:
• Overview
• Switch
• Wireless
• Host
• sFlow (Enterprise version only)
• PoE
• Provides an overview of alarm statistics, on/off-line status, CPU/memory utilization, performance status, traffic
statistics, and other information
• Different categories may have slight variations in the information provided
Customized Dashboard
• Allows user to configure the dashboard to display the information they need and apply it to the homepage
Monitoring
Network Discovery
• Allows user to configure the network discovery parameters, which include:
• Basic Information: the name of the network and site to discover. The discovered devices mange rule
• Probe Mode: to choose the primary and secondary probe
• Discovery Range: the range includes single IPv4/v6 Address, an IPv4/v6 Address range, an IPv4/v6 subnet or importing the range from a file
• Schedule: to define the discovery schedule which includes one-time discovery or recurrent discovery
• Displays all discovery rules’ running status and associated detail information
Device View
• Includes 5 categories: All, Managed, Unmanaged, Ignore and Conflicted
• Displays several device types: Switch, Wireless, Host and Other
• Displays the summary and detailed information of each device
• User can click “System Name” to check each device’s detailed information
• User can click “IP” to select a protocol to log in to the device
Interface View
• Listing devices’ connection relationship, which includes:
• System/Model Name
• Device’s IP address
• Interface and MAC address information
• VLAN information
• Uptime information
• D-View’s organization information
• Each item in the table provides search capability
• MAC Locator: user can look up for specific MAC address by using the search function in the “Connected MAC” column.
Topology Map
• Displays connections between devices
• Displays the on/off-line status of devices
• Displays the link status of devices
• PNG or JPG format files can be uploaded as the topology’s background image
• Supports Star, Tree, Circular and Grid type topology maps
• Zoom in and out the topology map
• Users can to create customized topologies
Connection View
• Listing the interface link information which includes:
• Link status
• Link name
• Name and IP address of two devices
• The connected interface of each device
• The connected devices and interface information
• Traffic statistics of TX and RX
• Link utilization
• Link type (LACP or general)
• Link’s related info update time
• Source of the detection, such as LLDP or FDB
• Clicking the link interface name’s hyper link, more detailed information will be displayed, such as:
• Summary information of the selected link
• Monitor information of the selected link
• Alarm information of the selected link
Rack View
• Provides users visualization of the actual device rack
sFlow Analyzer (Enterprise version only)
• Collects the sFlow data from devices and generates related statistics reports
• The statistics report information includes:
• Report based on the source or destination of packets
• Report based on QoS rules
• Report based on layer 4 applications
• Report based on two nodes’ conversation
Device Group
• Allows users to create device groups
• Device grouping to simplify the firmware or configuration file maintenance
Configuration
Batch Configuration
• Allows customer to simultaneously configure multiple devices’ parameters
• Two sub-features:
• Quick Configuration: provides a GUI template for each function to apply the settings to multiple devices
• Advanced Configuration: allows user creating a profile for a specific type of device and the profile contains multiple features’ parameters. User can apply the profile to multiple devices which have the same type/model as the profile.
Task Management
• Lists all user created tasks to understand the execution result
• This feature includes:
• Current Tasks: lists the descriptions of current tasks
• Historical Tasks: lists the descriptions of historical tasks
• Each task result will include a message to describe the success status. If a failure happens, it will also describe the reason of failure.
Firmware Management
• Allows users to manage device’s firmware via D-View 8
• Uploading or downloading the firmware to or from the device
• Upgrading device by specifying schedule
• If firmware image already exists in D-View 8, user can just select the file without uploading a new one again
• Displays the failure message to understand the root cause
Configuration Management
• Allows users to manage device configuration via D-View 8
• Users can backup or restore multiple device configuration files at the same time
• Users can backup or restore the file by specifying a schedule
• Supports baselined configuration file comparison, auto restore and generate alarm feature
File Management
• Allows users to compare configuration files to verify the differences between the two files
• Allows users to upload or delete configuration or firmware files on D-View
• Allows users to set the configuration file as the baselined file
Alarms & Notifications
Alarms
• Displays all alarm information collected from network devices. The alarms include:
• Active Alarms
• Lists all unresolved or unacknowledged network alarms
• Historical Alarms
• Lists all resolved or acknowledged network alarms
Trap & Syslog
• Displays the trap and system log receiving from devices or the system.
• The trap log’s information contains
• Time received
• Device system name
• Device IP address
• SNMP version
• Trap description
• Original message of the trap
• The associated alarm of the trap (Users can select optional columns to display)
• The site and network which the related device belongs to (Users can select optional columns to display)
• The syslog information contains:
• Time received
• System name of device generating the syslog
• Device IP address
• Syslog severity levels
• Syslog messsages
• The associated alarm of the syslog (Users can select optional columns to display)
• The site and network of related devices (Users can select optional columns to display)
Trap Editor
• Allows customer to edit a readable trap message for a specific trap OID
Monitor & Alarm Settings
• Monitor Settings
• Configure the monitor status to let D-View collect data according to the established time intervals
• Alarm Settings
• Configure alarm rules to let D-View generate alarms when collected data matches user configured thresholds
• Configure the CLI to let devices and D-View servers execute when the alarms are triggered
• Alarmable Items Definition
• Define the items for customized monitors and set thresholds to trigger alarms
Notification Center
• Allows user to set the notification method when alarms are triggered. The methods include: Web Scrolling Message, Email, App Push Notification and Execute script.
Device Template
• This feature allows user to easily add a device to be managed by D-View 8 if it’s not in the default managed list; a useful tool especially for managing third party devices
• Allows user to customize device’s information by providing:
• Model Name
• Device Type
• Vendor Name
• Device’s System OID (SOID)
• Panel Template
• Allow users to expand D-View’s monitoring and configuration capabilities for device models. Provide a way to associate the existed monitor and configuration templates
Device Support
Allows user to create useful information to manage third party vendor and devices, which includes:
• Vendor information
• Vendor name
• Vendor OID
• Device Category
• Category name
• Photo of the category. The file type can be PNG or JPG format (less than 2 MB in size)
• Device Type
• Type name
• Device category (data comes from Device Category)
• Description
Panel Template
• Includes D-Link default device panel templates
• For third party devices, user can create customized panels
• Customizable panel details:
• Panel name
• Stacking support status
• Description
• Customizable Panel diagrams:
• Panel logo (PNG/JPG files less than 2 MB in size)
• Panel height and width
• Port numbering rule
• Port layout design using drag and drop
Monitor Template
• Provides different monitoring templates for collection of device information
• Customizable Monitor Category for classification of monitored data:
• Category name
• Unit of the monitored value
• Data collection protocol (SNMP/ HTTP / HTTPS)
• Status switch to define whether collected data need to be merged in different time intervals
• Category description
• Monitored data source
• Customizable Monitor Template to monitor and collect defined objects
• Template name
• Monitor category chosen
• Device vendor name
• Monitor interval
• Monitor template description
• Object’s monitored OID information
• Script file to process collected data
Configuration Template
• Provides multiple configuration templates to configure specific devices via D-View 8
• Multiple config templates can be assigned to Device Template to configure a specific device.
• Customizable Configuration Category templates classified by function
• Category name
• Configuration type
• Template description
• Category feature parameter information
• Customizable Configuration Template to configure specific devices via D-View 8
• Configuration template name
• Vendor name
• Template description
• Selected configuration template to configure device
• Method of configuration (CLI or SNMP)
• CLI commands list (if selected)
• Programable GUI object to simplify continuous operation
Report
General Report Types
Each report type can have configurable parameters such as data range and data collection time interval. When reports are generated, they can be exported immediately, saved to My Report, or upgraded to Scheduled Report according to the configured report parameters.
• Device Reports
• Device Health
• Trap
• Syslog
• Device Top N
• Wired Interface Reports
• Wired Traffic
• Wired Throughput Top N
• Wireless Reports
• Wireless Client Count
• Wireless Traffic
• Advanced Reports
• Inventory
Scheduled Report Types
Each report type can be a one-time report or recurrent report. User can designate data source device(s) and levels of alarms to be displayed in the reports.
• Alarm Report
• Trap Report
• Syslog Report
Tools
MIB Browser (Enterprise version only)
• Retrieves and displays MIB data from compiled MIB in readable format
• Provides a graphical format to read MIB information
MIB Compiler (Enterprise version only)
• Compiles device MIB files into D-View 8
• The MIB Compiler allows users to compile standard or proprietary MIBs, but does not accept malformed MIBs. The compiled MIB file can then be loaded and managed only in the MIB browser instead of generating a new built-in template automatically.
ICMP Ping
• Checks device operation status and network performance
SNMP Test
• Checks device SNMP capabilities using SNMPv1, SNMPv2c or SNMPv3
Trace Route
• Checks the route and measures transit delay of packets crossing the network
Command Line Interface (CLI)
• Terminal interface for user to connect with device
File Comparison
• Lets user compare differences between two configuration files
• Differences are highlighted in different colors to identify modification types
Wizard Types
• D-View 7 Upgrade Wizard
• A guide for upgrade from D-View 7 to D-View 8
• Discovery Wizard
• Discovers the network and add devices to be monitored
• Monitoring Wizard
• A guide to generate the topology, dashboard and rack views
• Alarm Wizard
• A guide to configure the alarm and notification features
Certificates
Order info
D-View 8 D-View 8 Network Management Software
Pictures
D-View 8 ver.2